PwC Divestment Analysis portal
The Challenge:
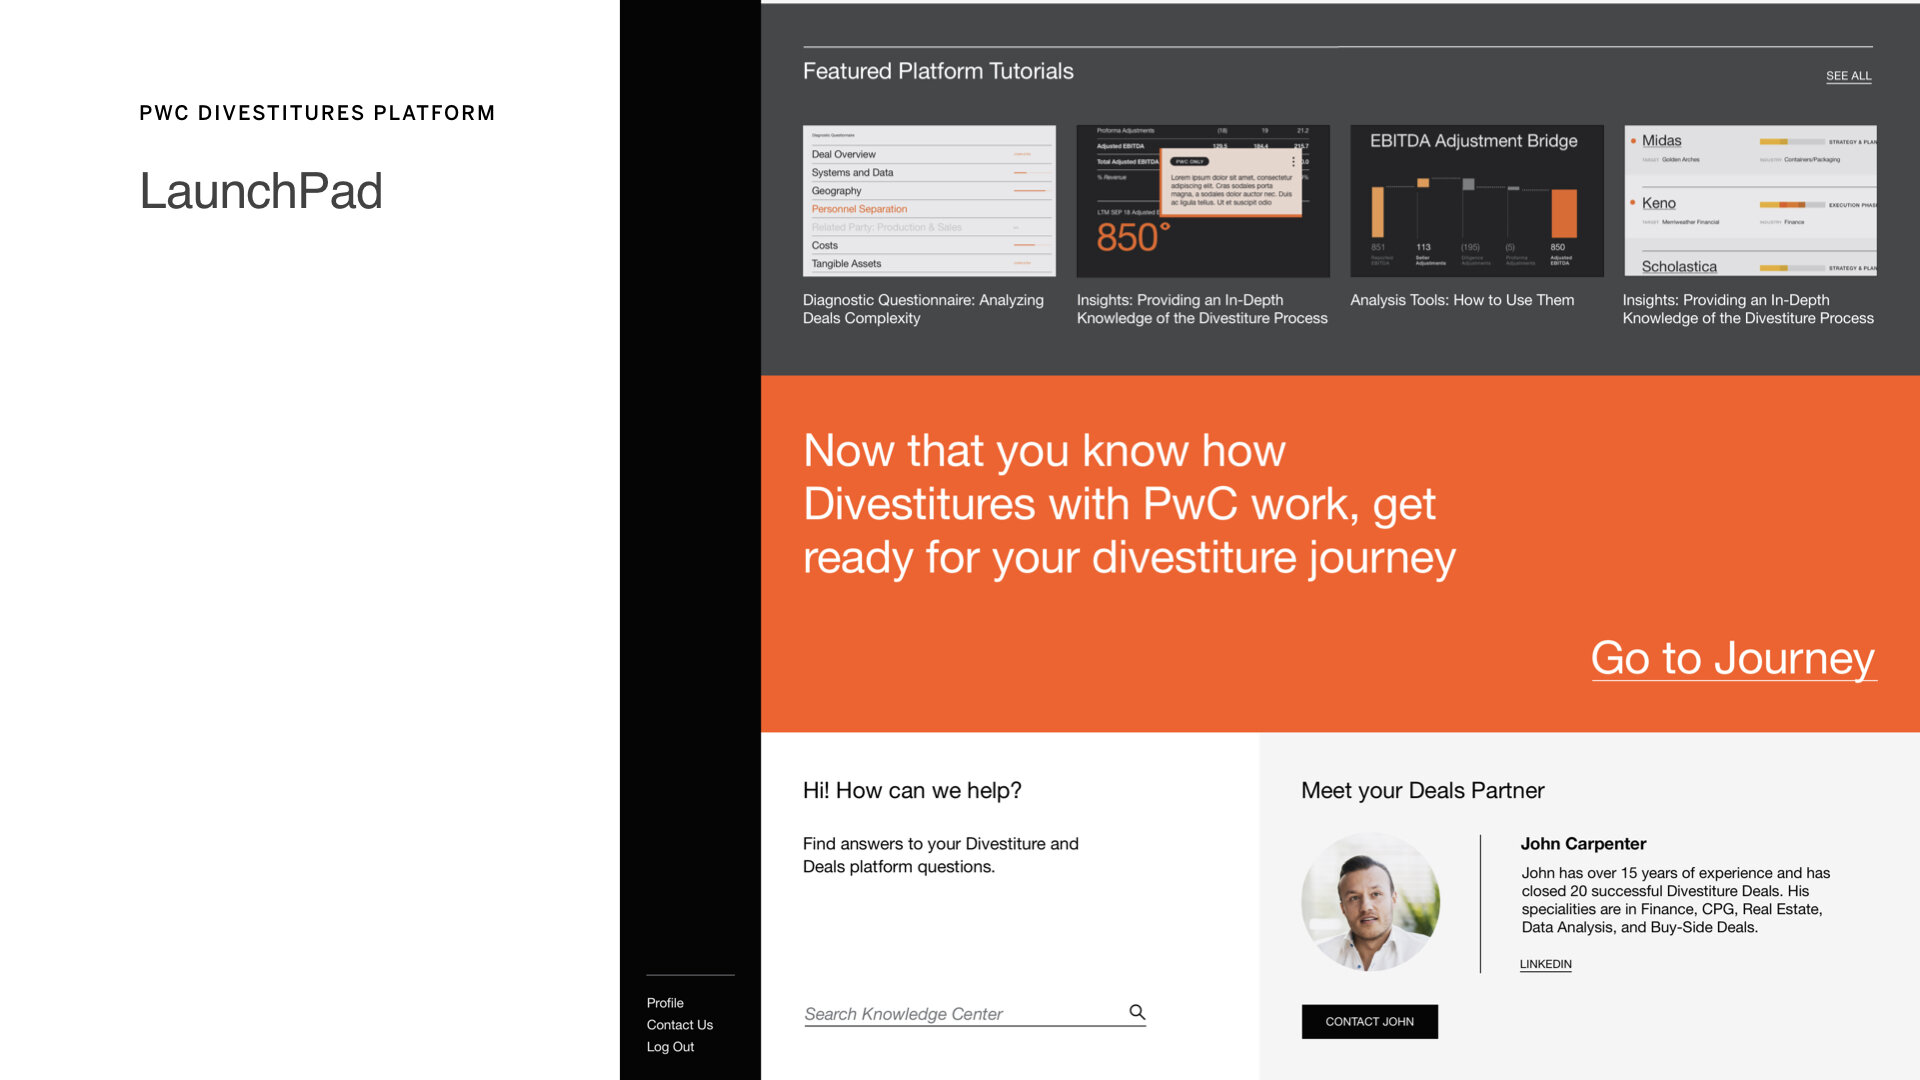
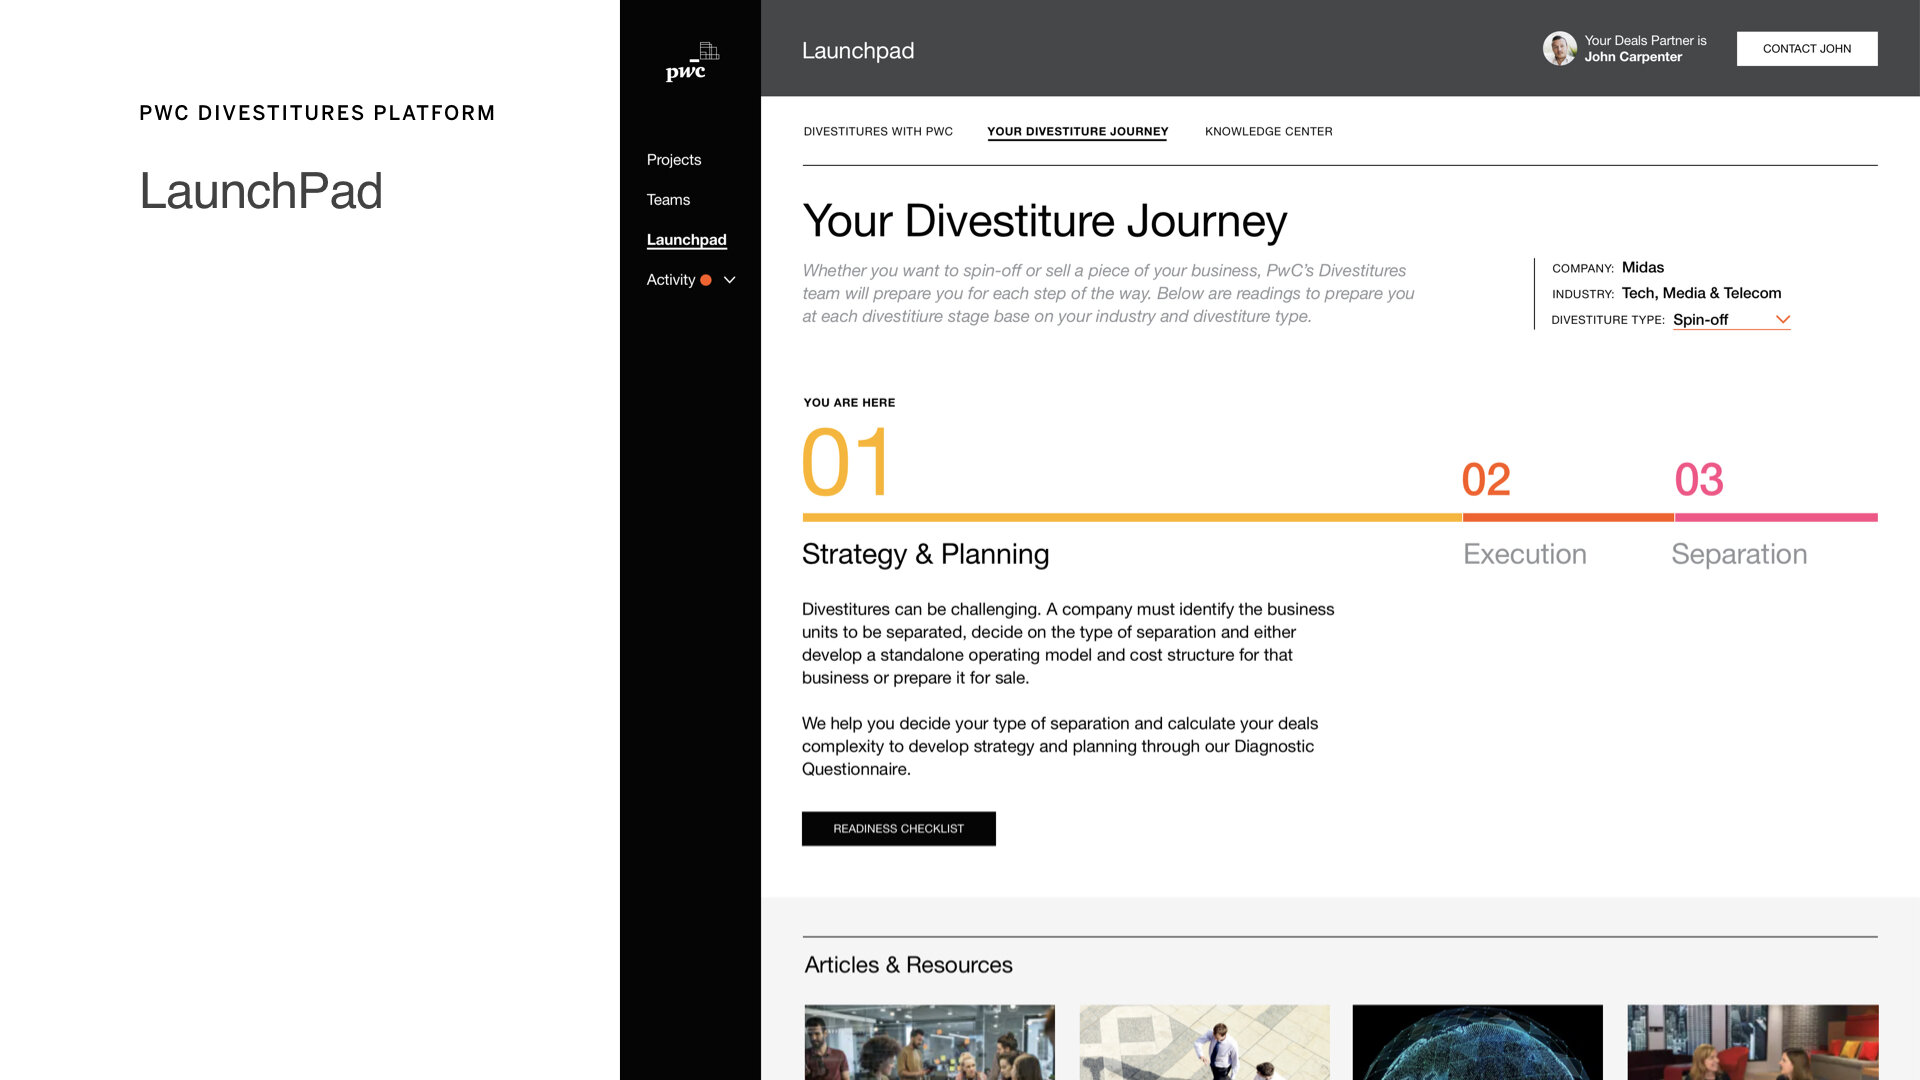
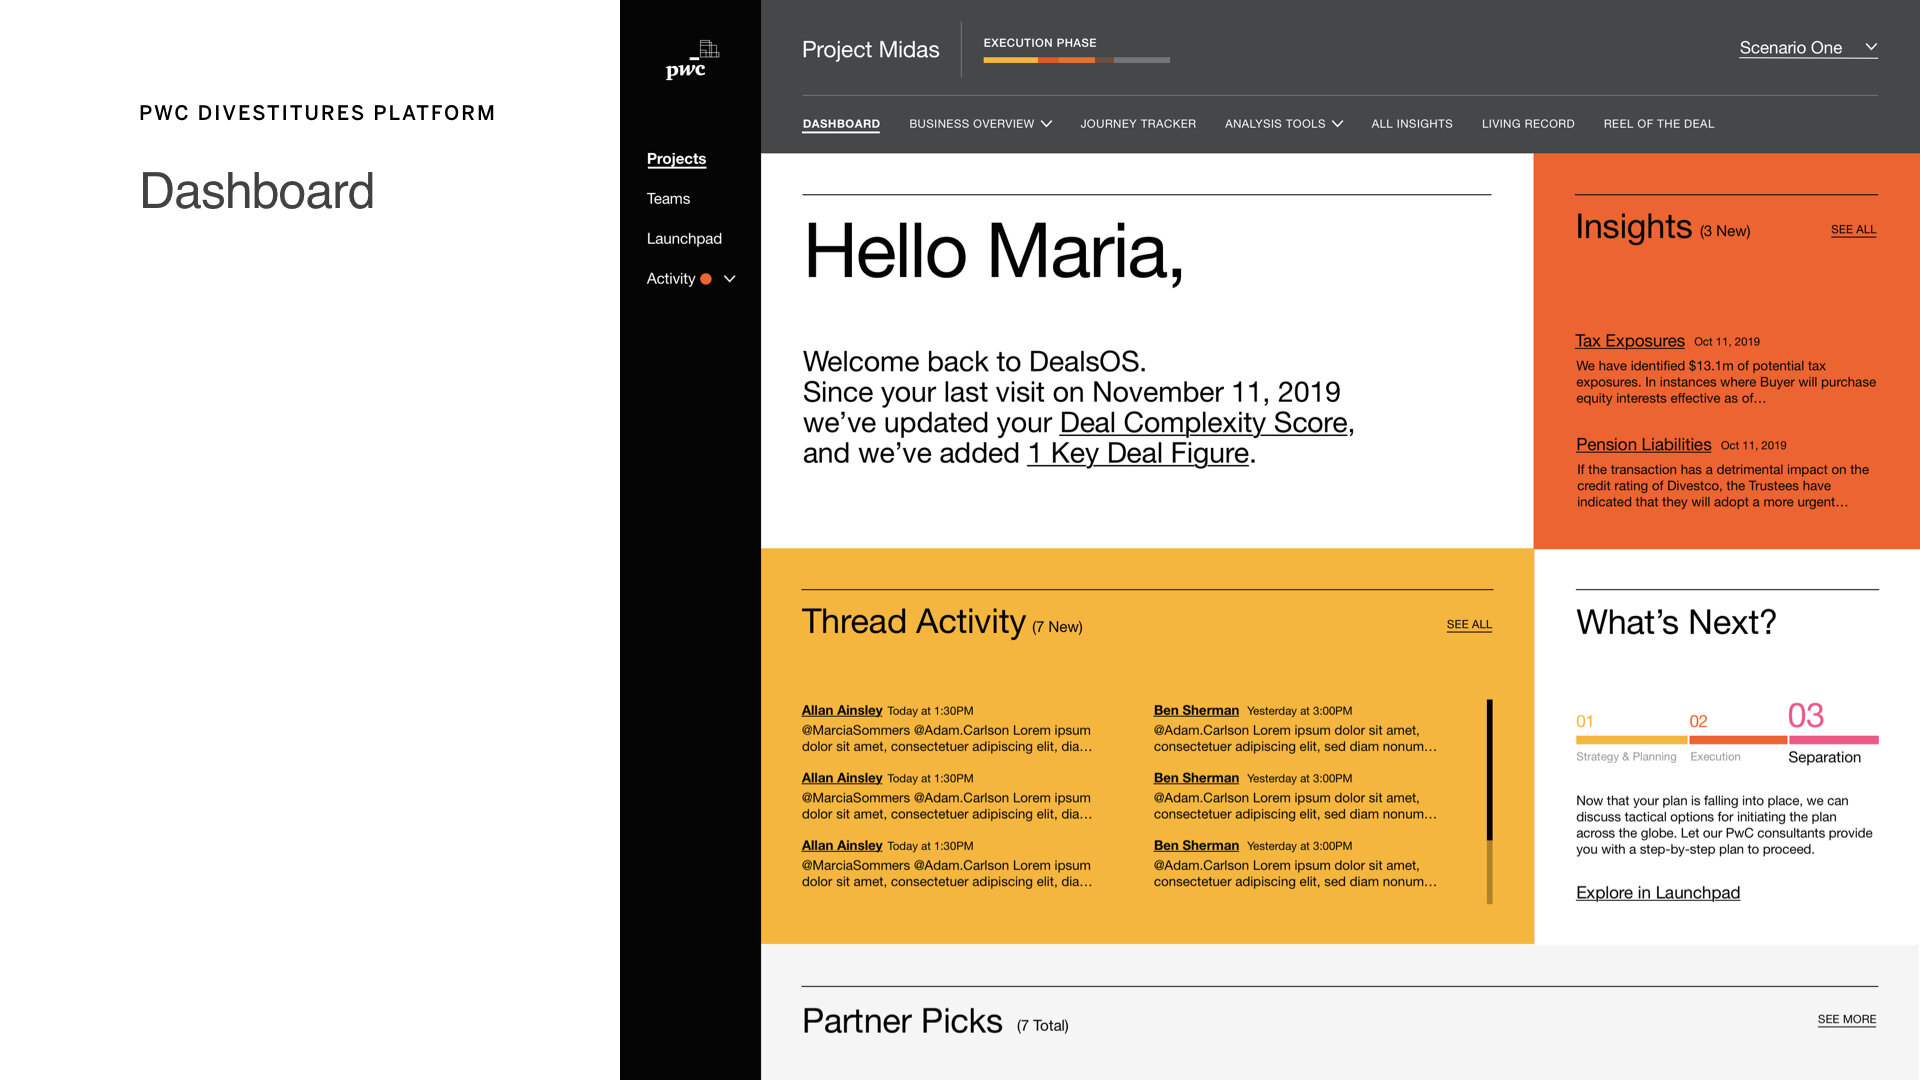
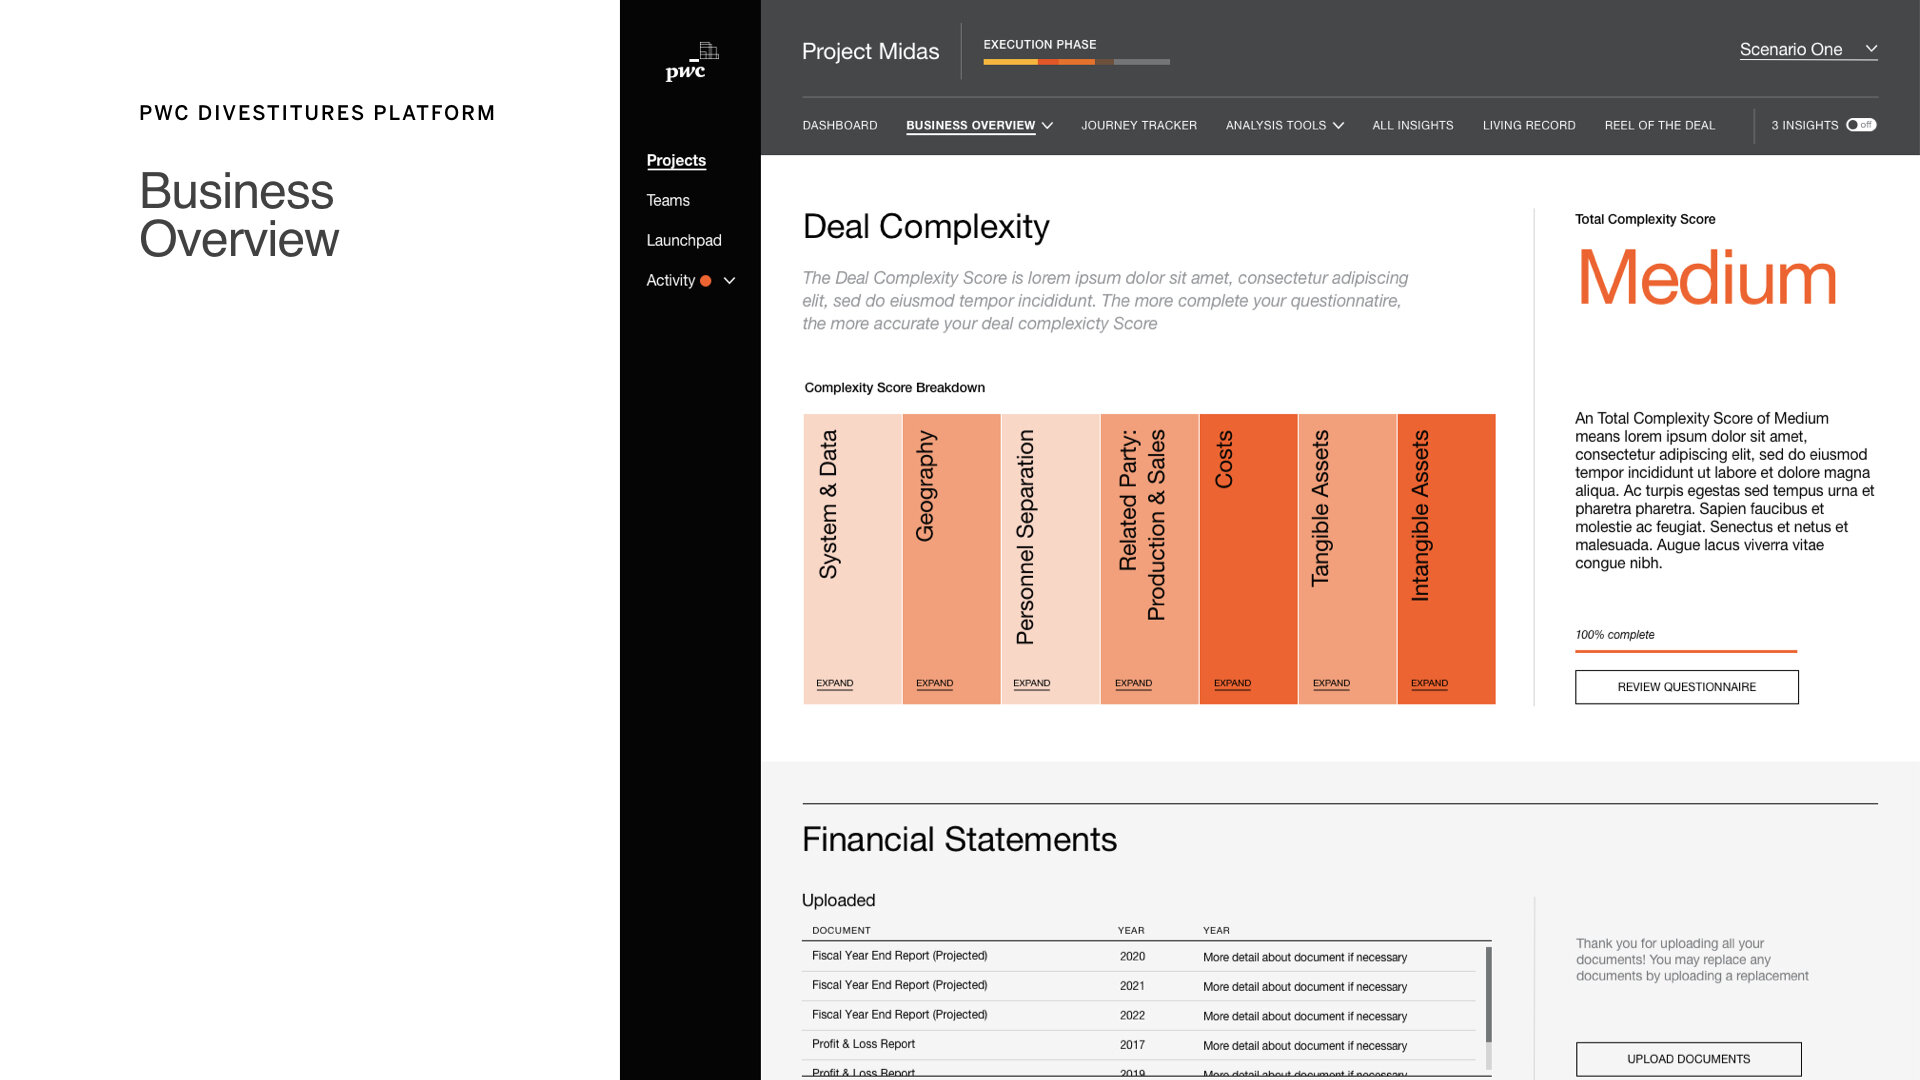
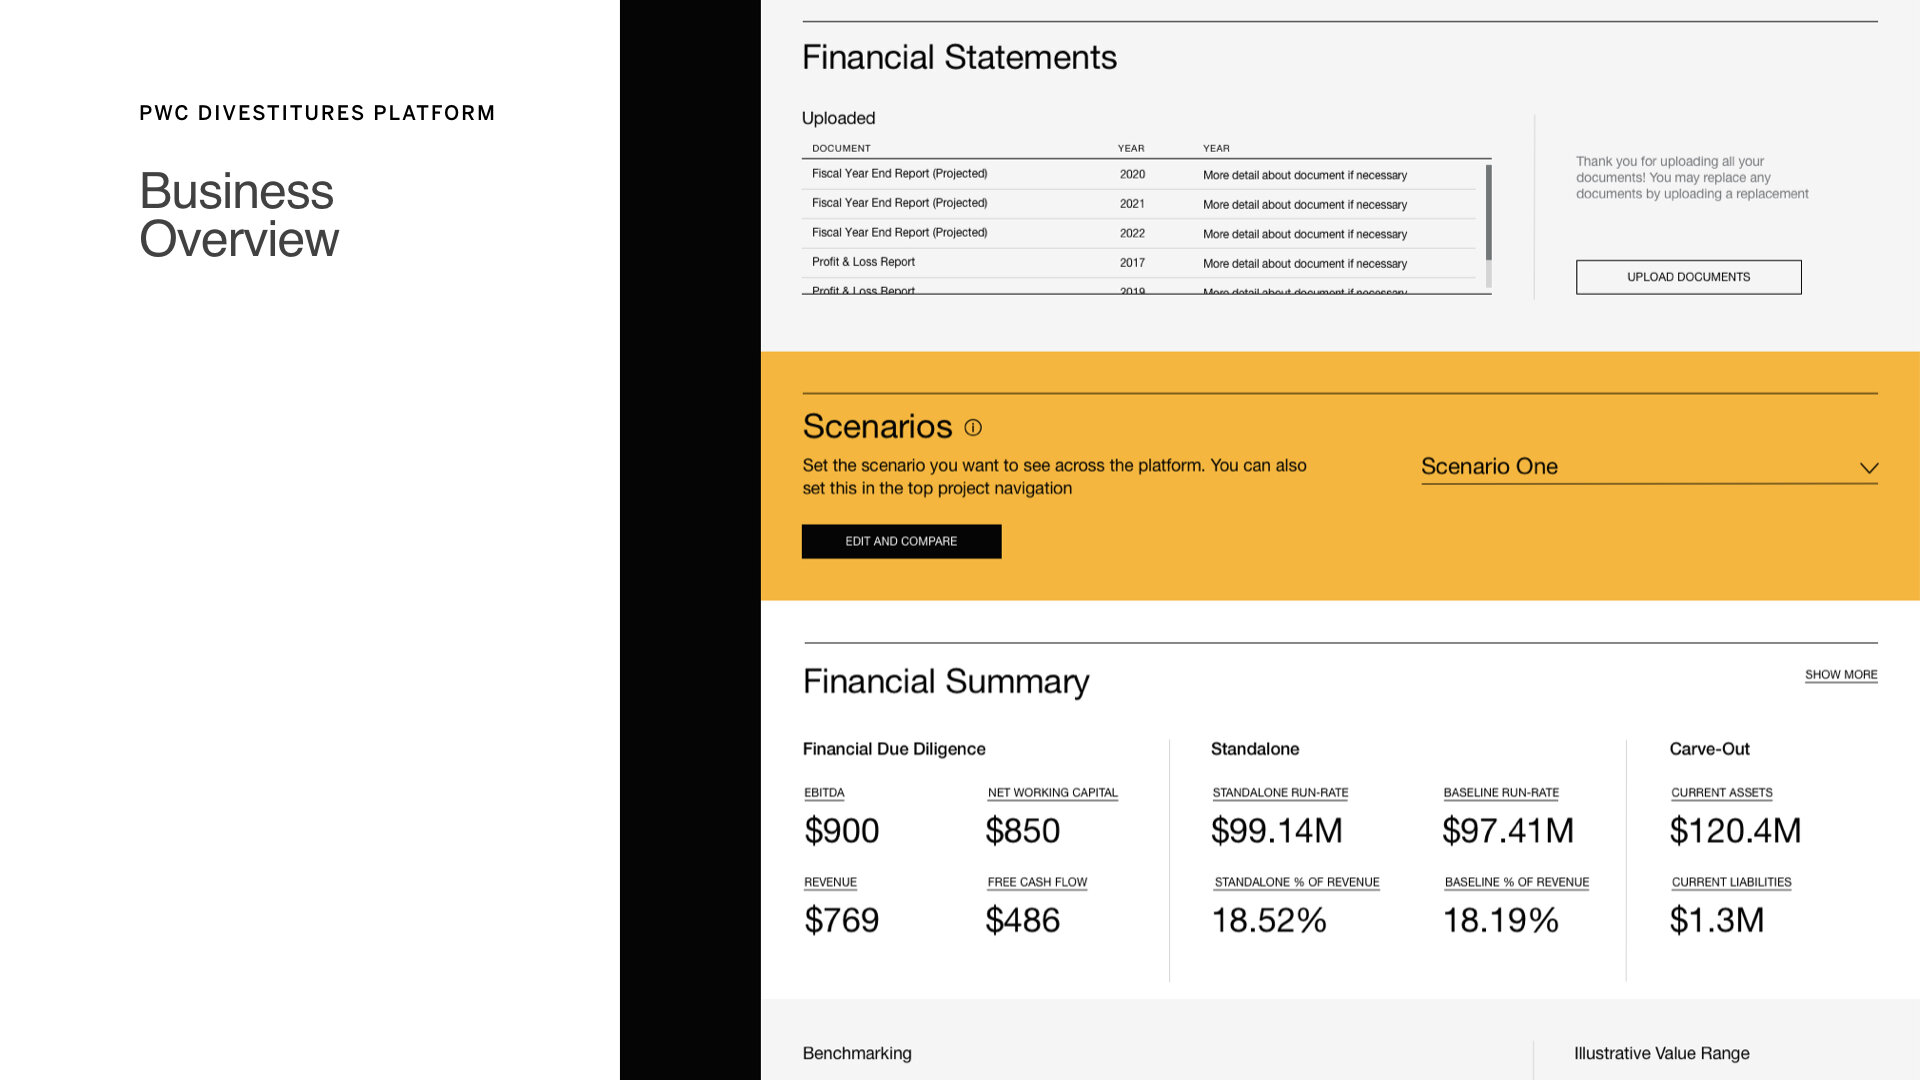
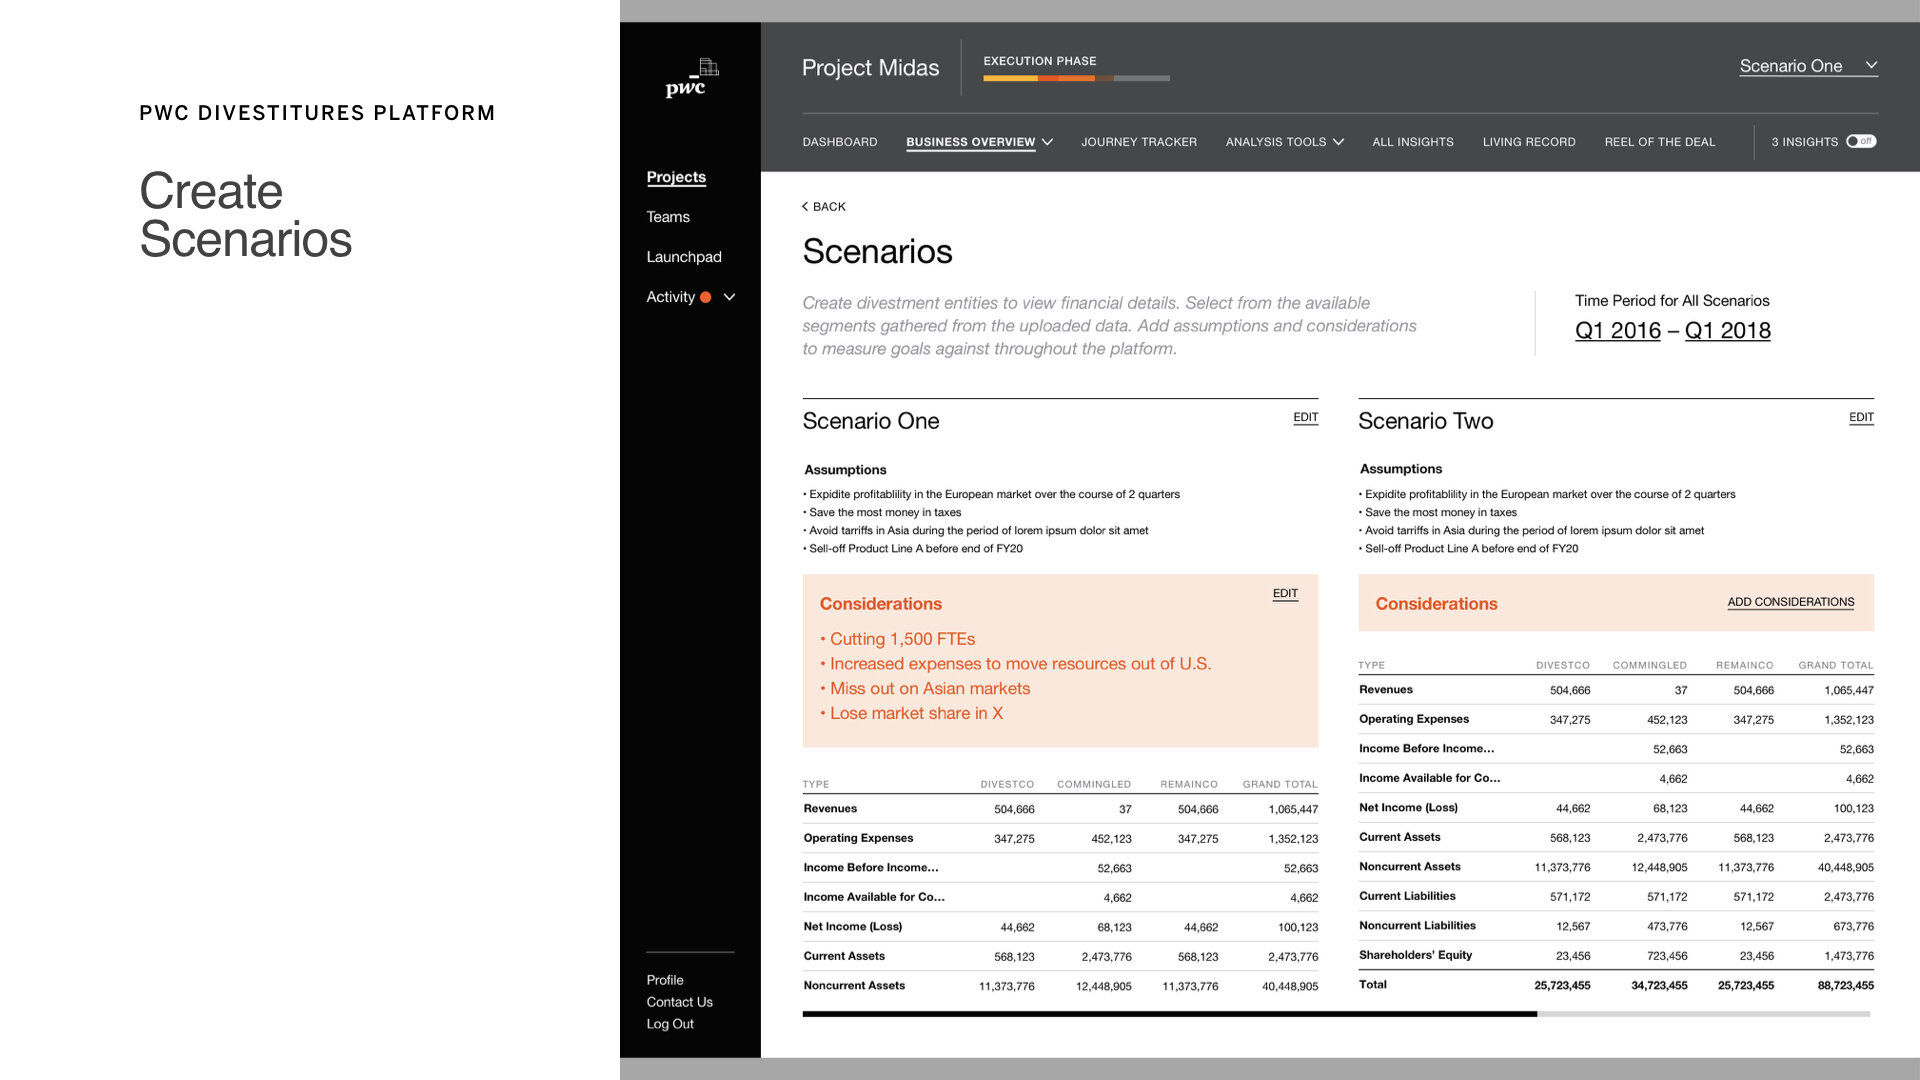
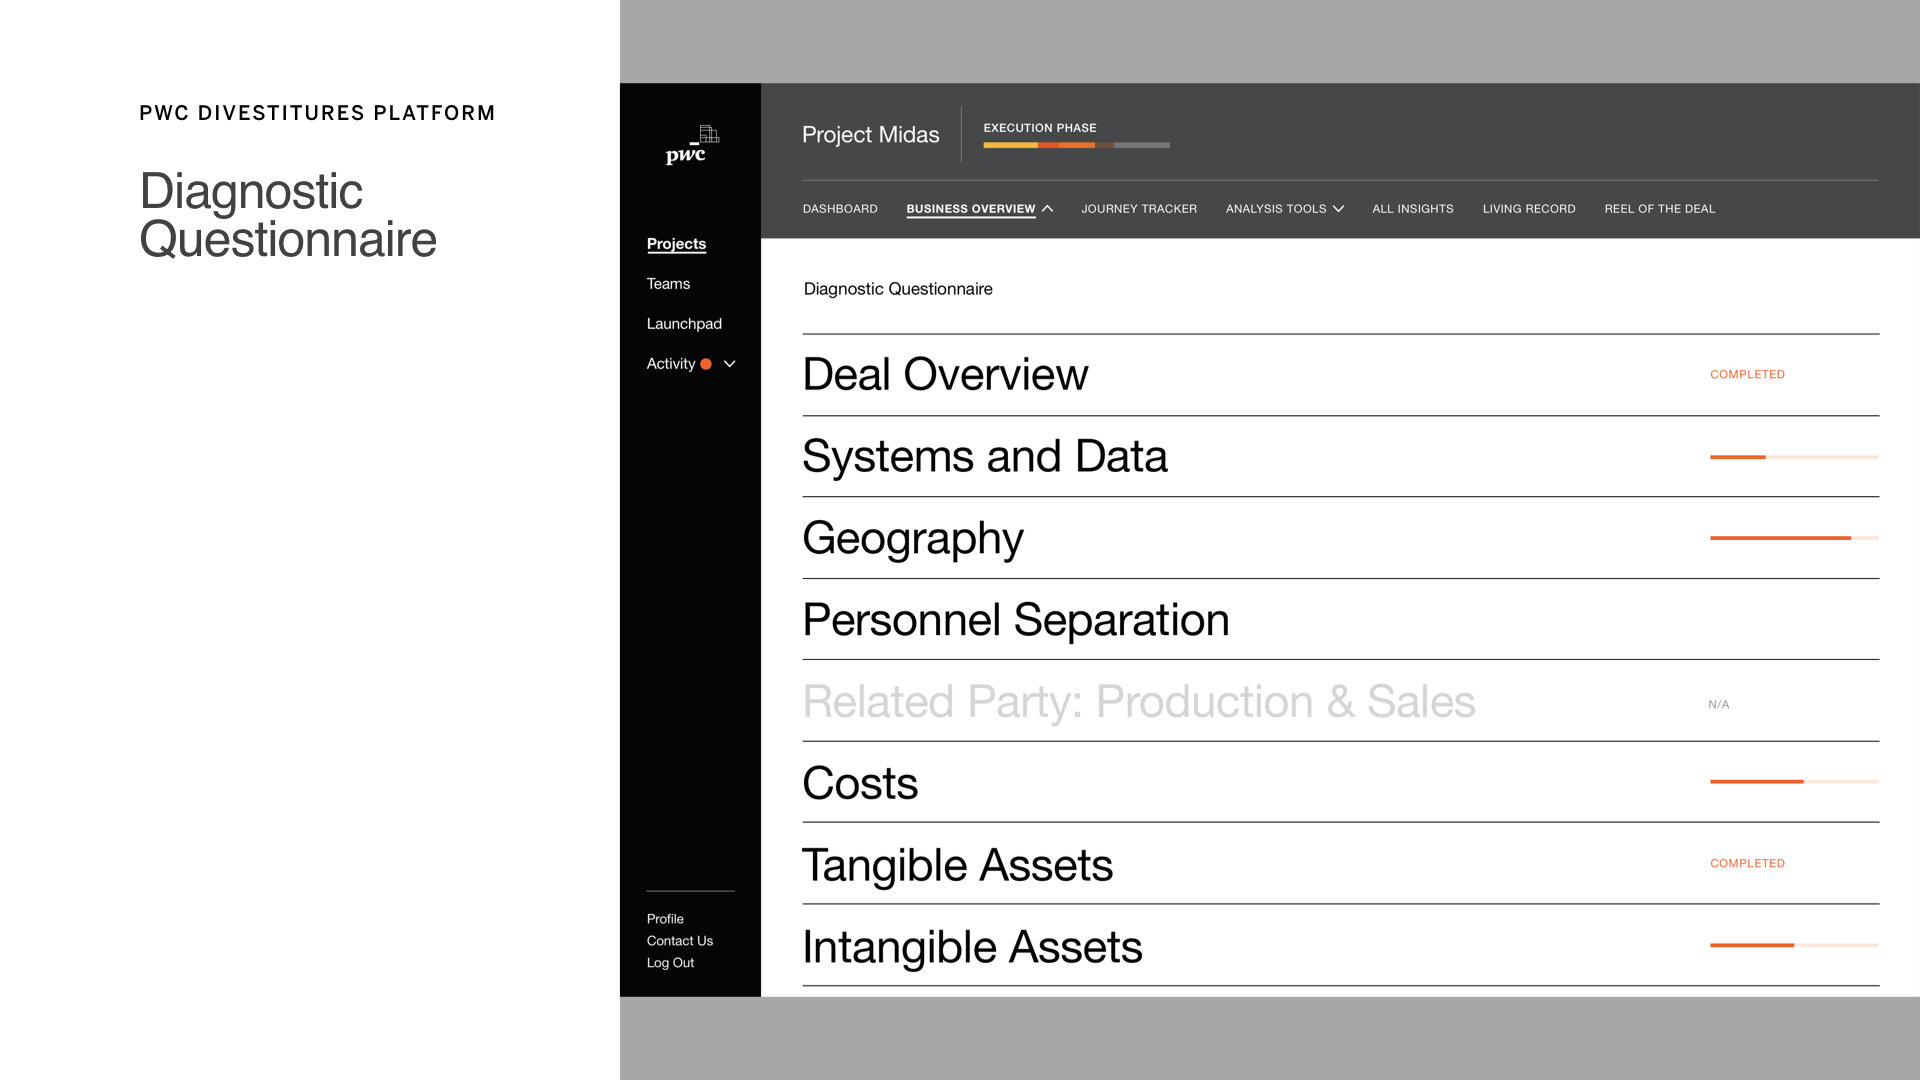
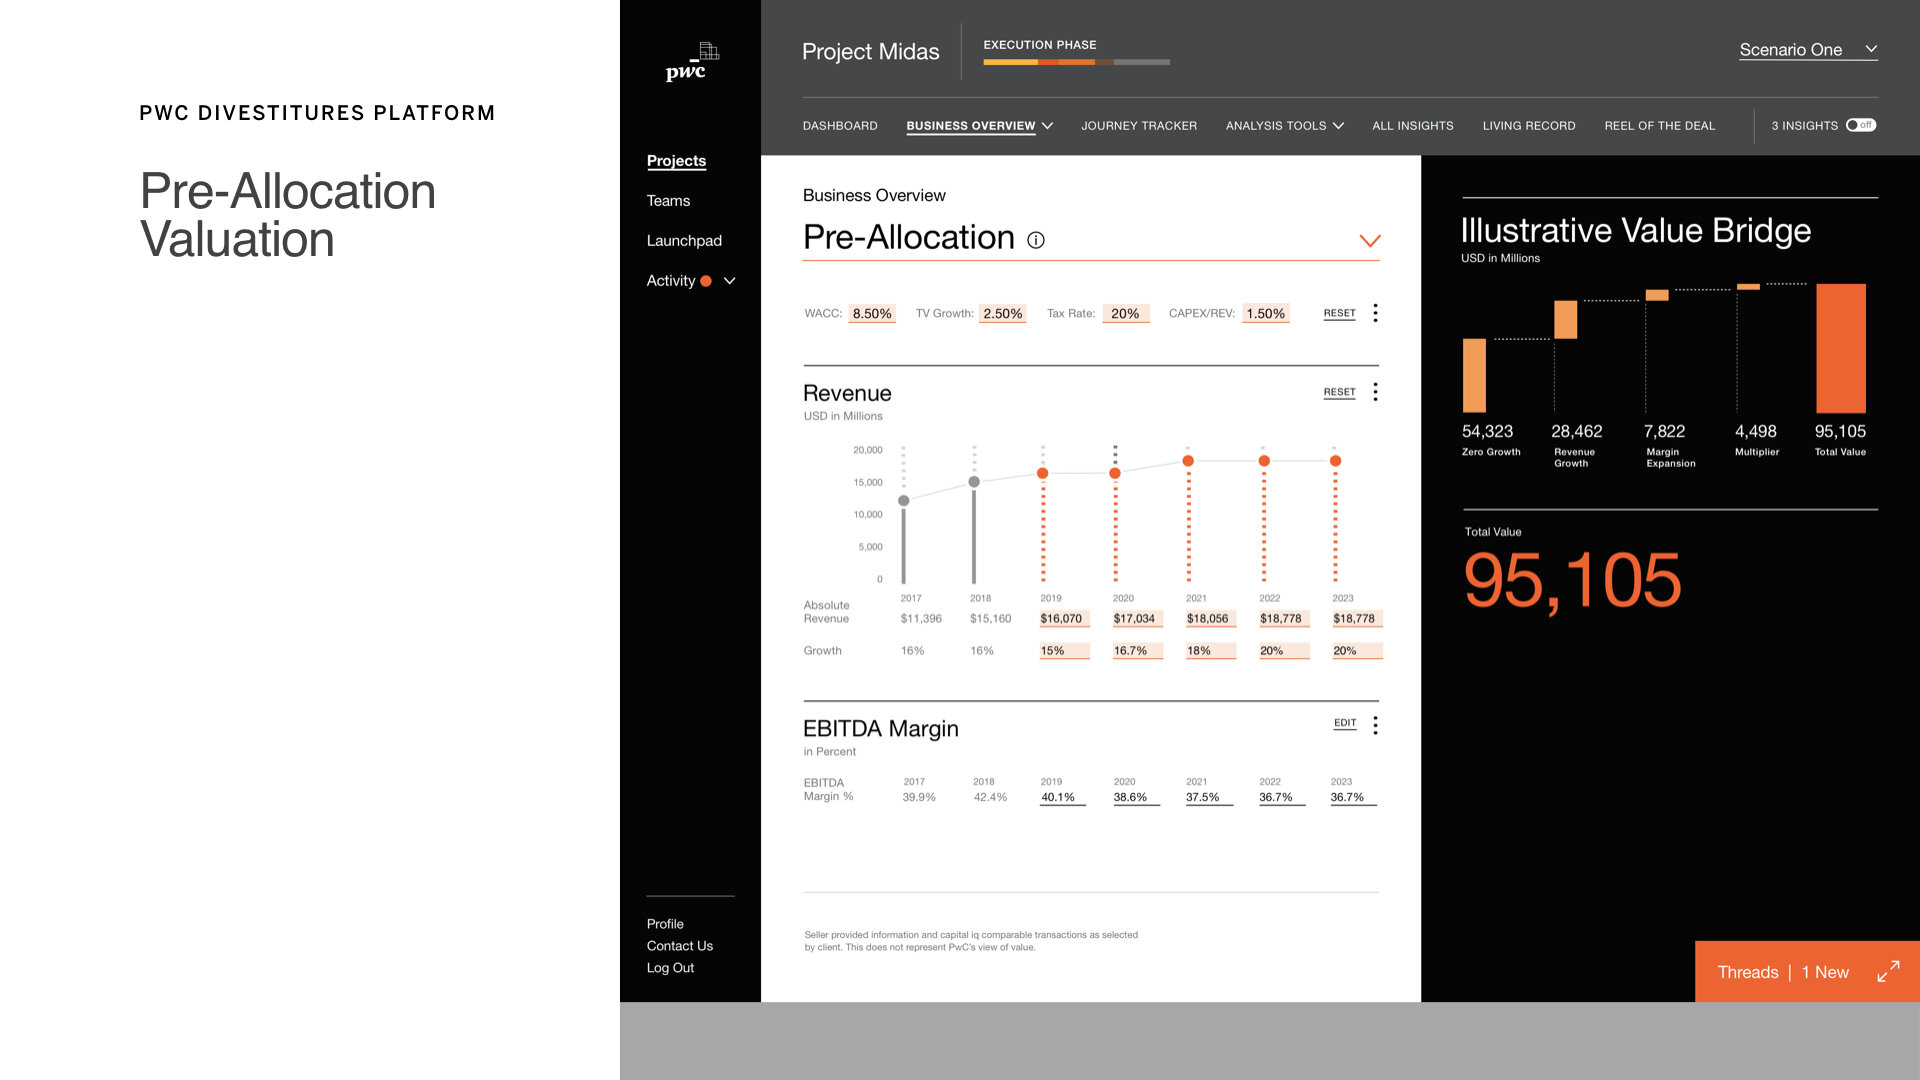
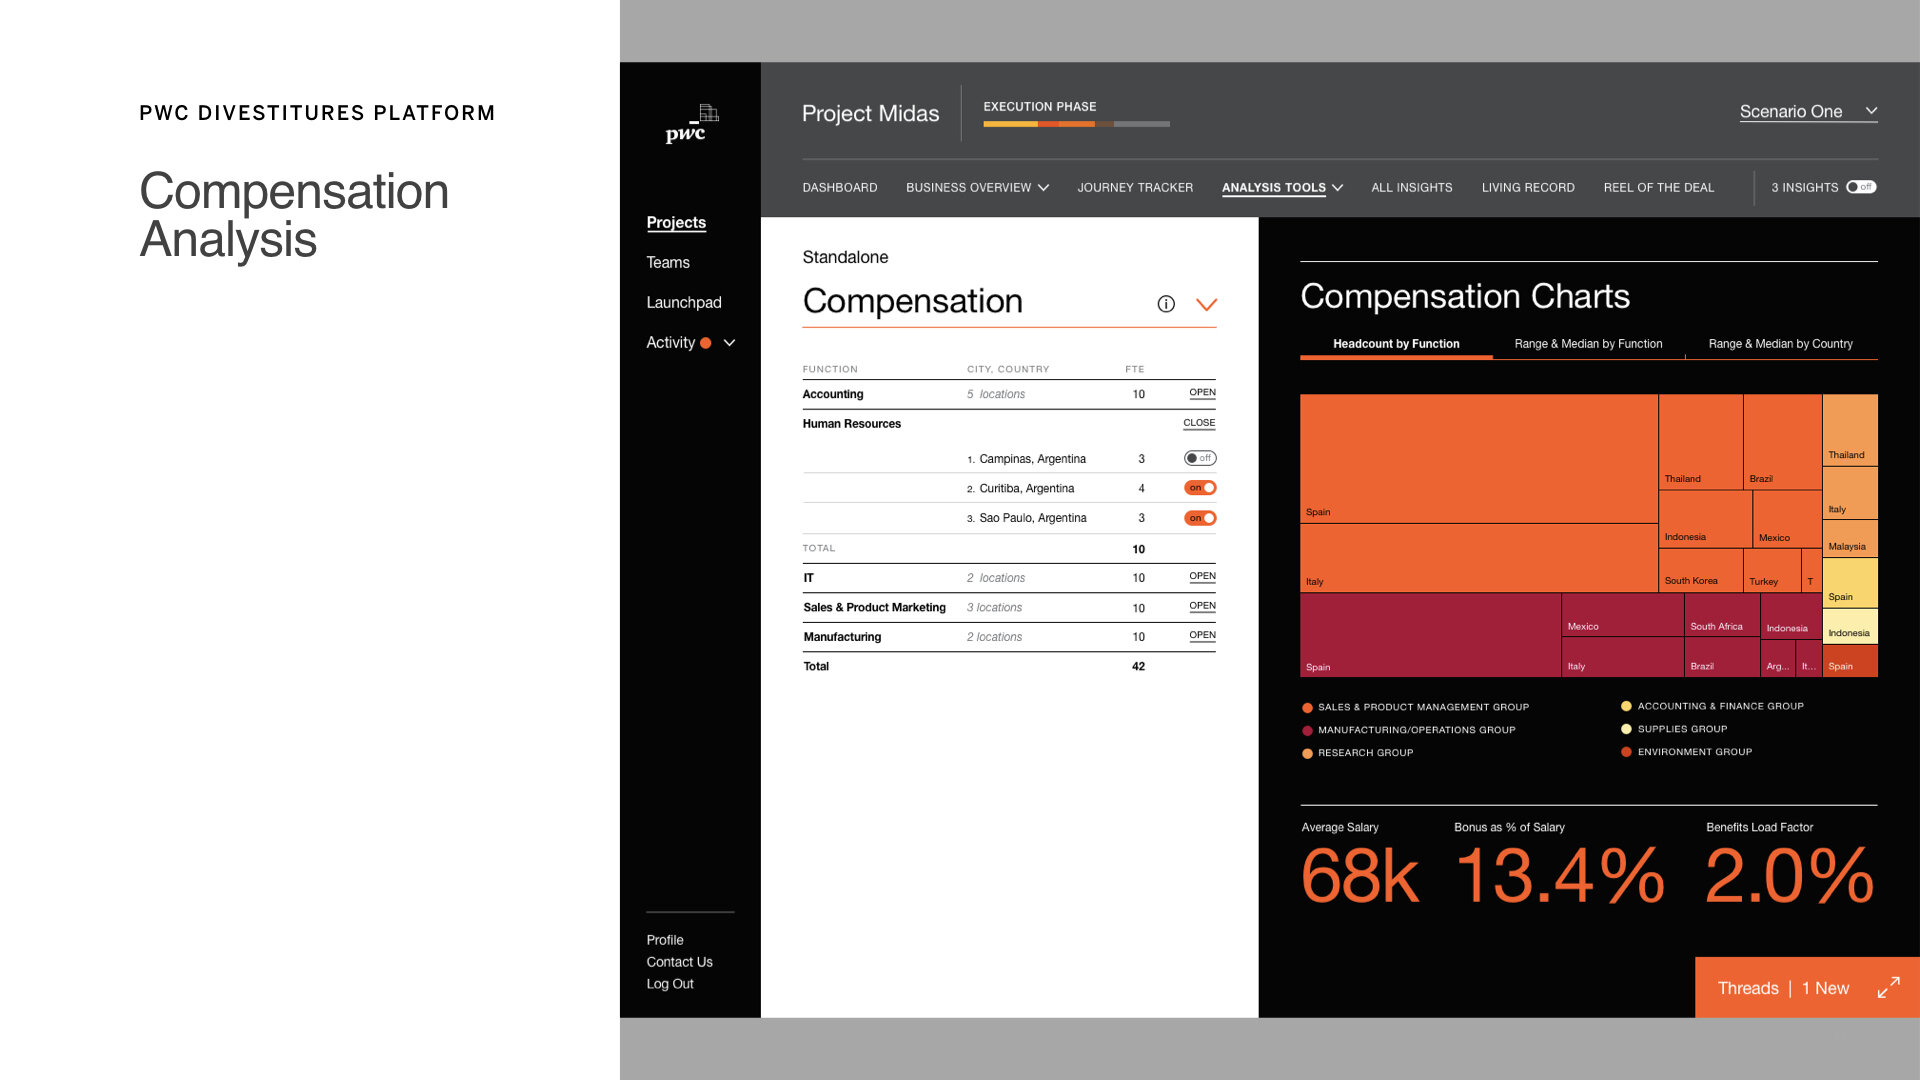
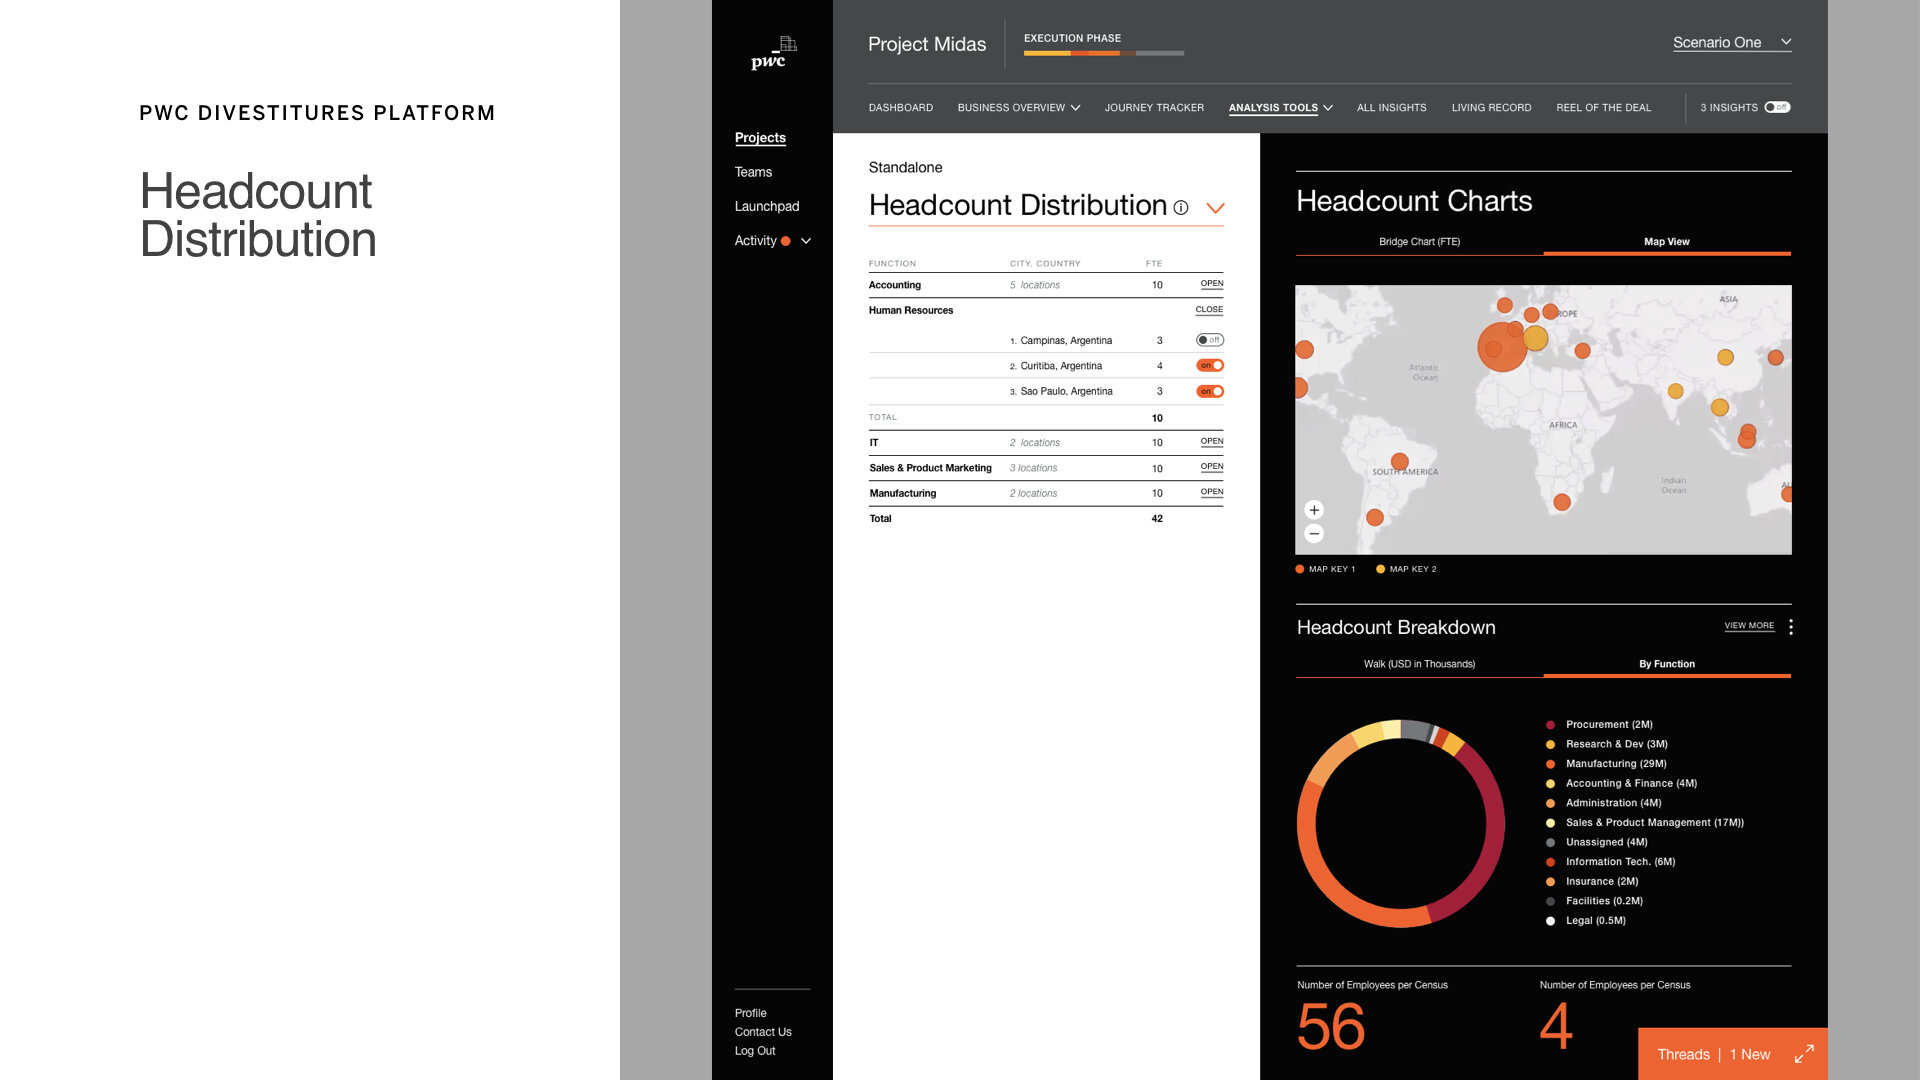
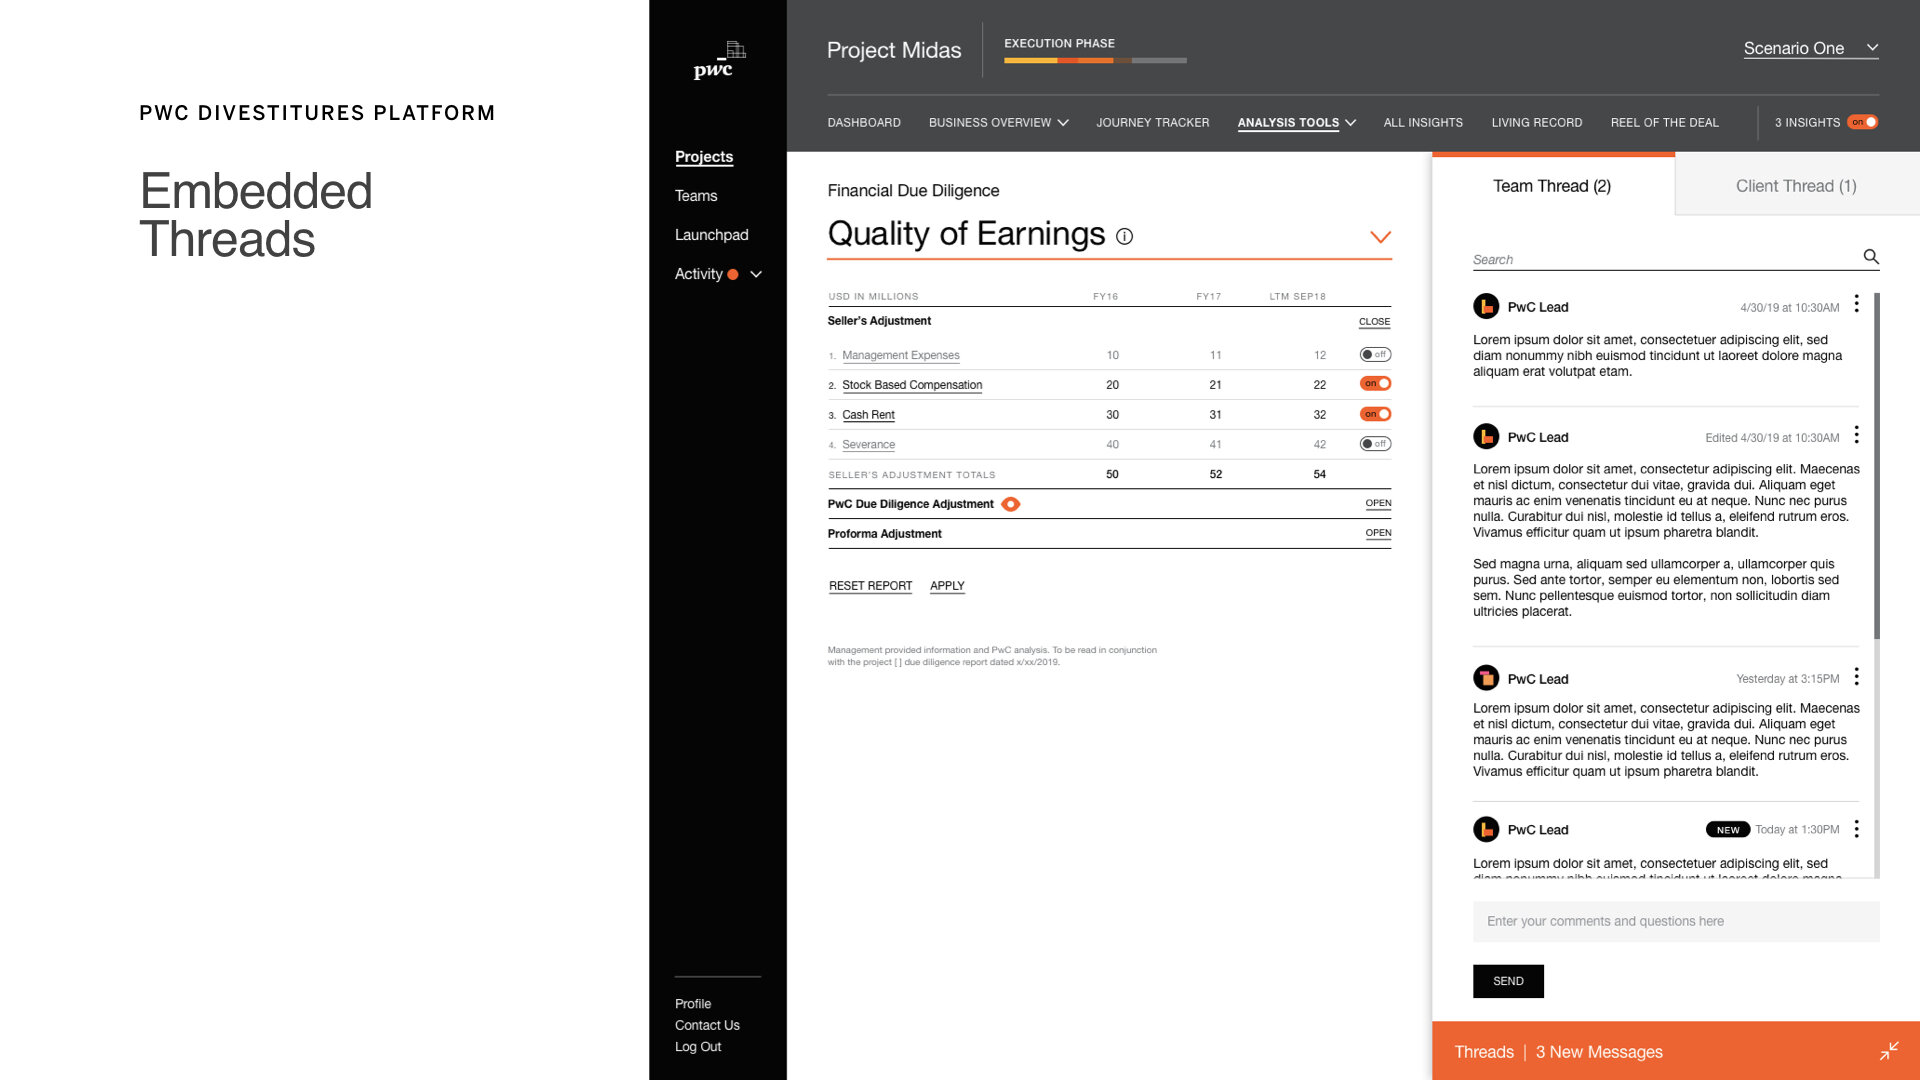
Utilizing a design language defined in a previous track of work for the acquisitions process, define the features and functionality to aid in consultants' analysis of a business and give strategies for the divesting of assets and product lines. The platform guides both consultants and clients in gathering years of complex data, defining subsets of the business to examine its standalone performance and potential value in the marketplace.
The Process:
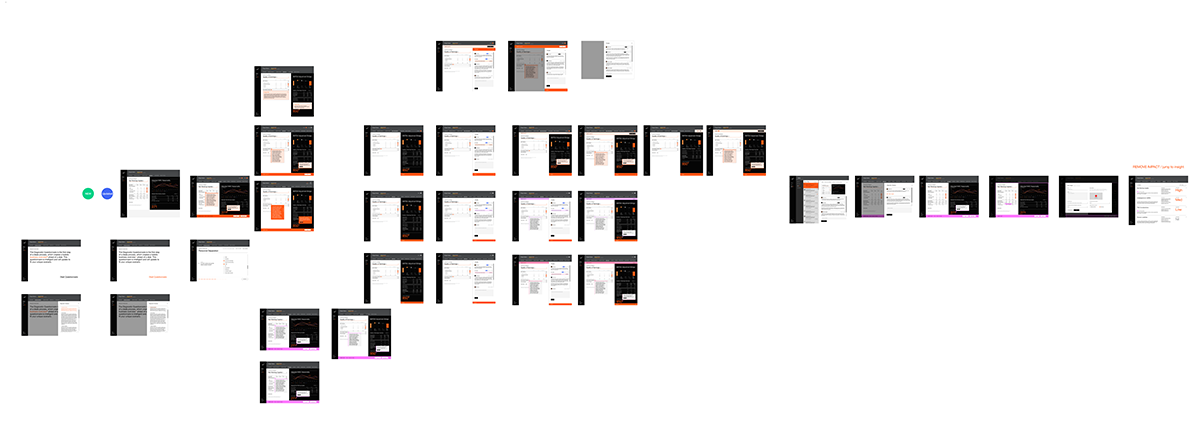
Our aggressive roadmap defined twenty features this platform needed to accommodate. We decided on the order and priority of the features, which were broken up into two-week sprints, with 5-7 features per sprint.
Partnering with PwC leadership, we held daily meetings to review requirements, content, and design. Weekly team share-outs let stakeholders and the wider group see progress and give feedback.
I led the interaction design by defining how the navigation and design system would accommodate the features. I created wireframes and paired them with the visual and junior interaction designers to flesh out these solutions. The creative director of the project helped guide the direction of the product. She also led the presentation and client management components of the engagement. Our small and mighty team created an innovative, branded experience for this enormous component of PwC’s business.

Process Work defining Sprints and Features to include

The Result:
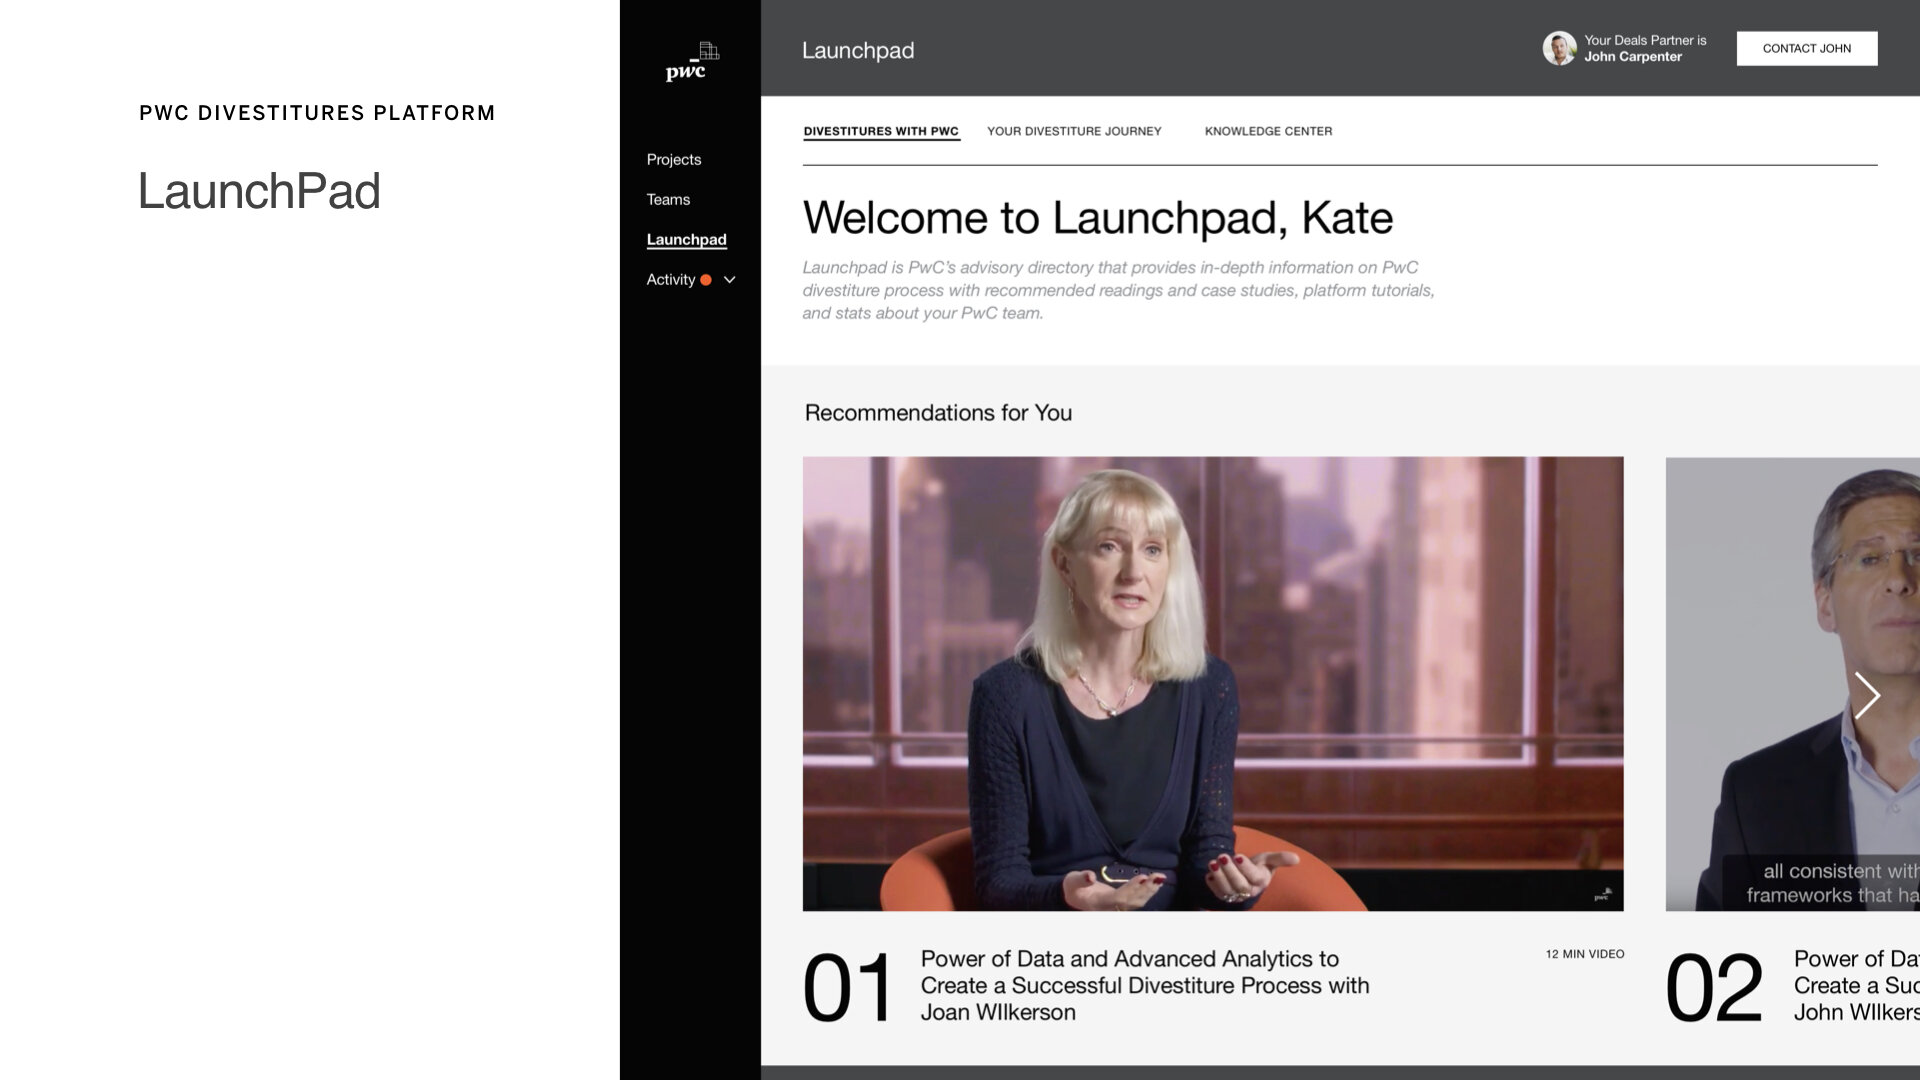
Over 8 weeks, we created a comprehensive design system that accomplished all the required features—client onboarding questionnaire, Data input & visualizations, commenting, and team-building within the platform. The PwC development team is currently building this platform. PwC continues to work with frog to lead the change management efforts. Building transitional products to prepare the global organization using this platform upon completion.
In Addition:
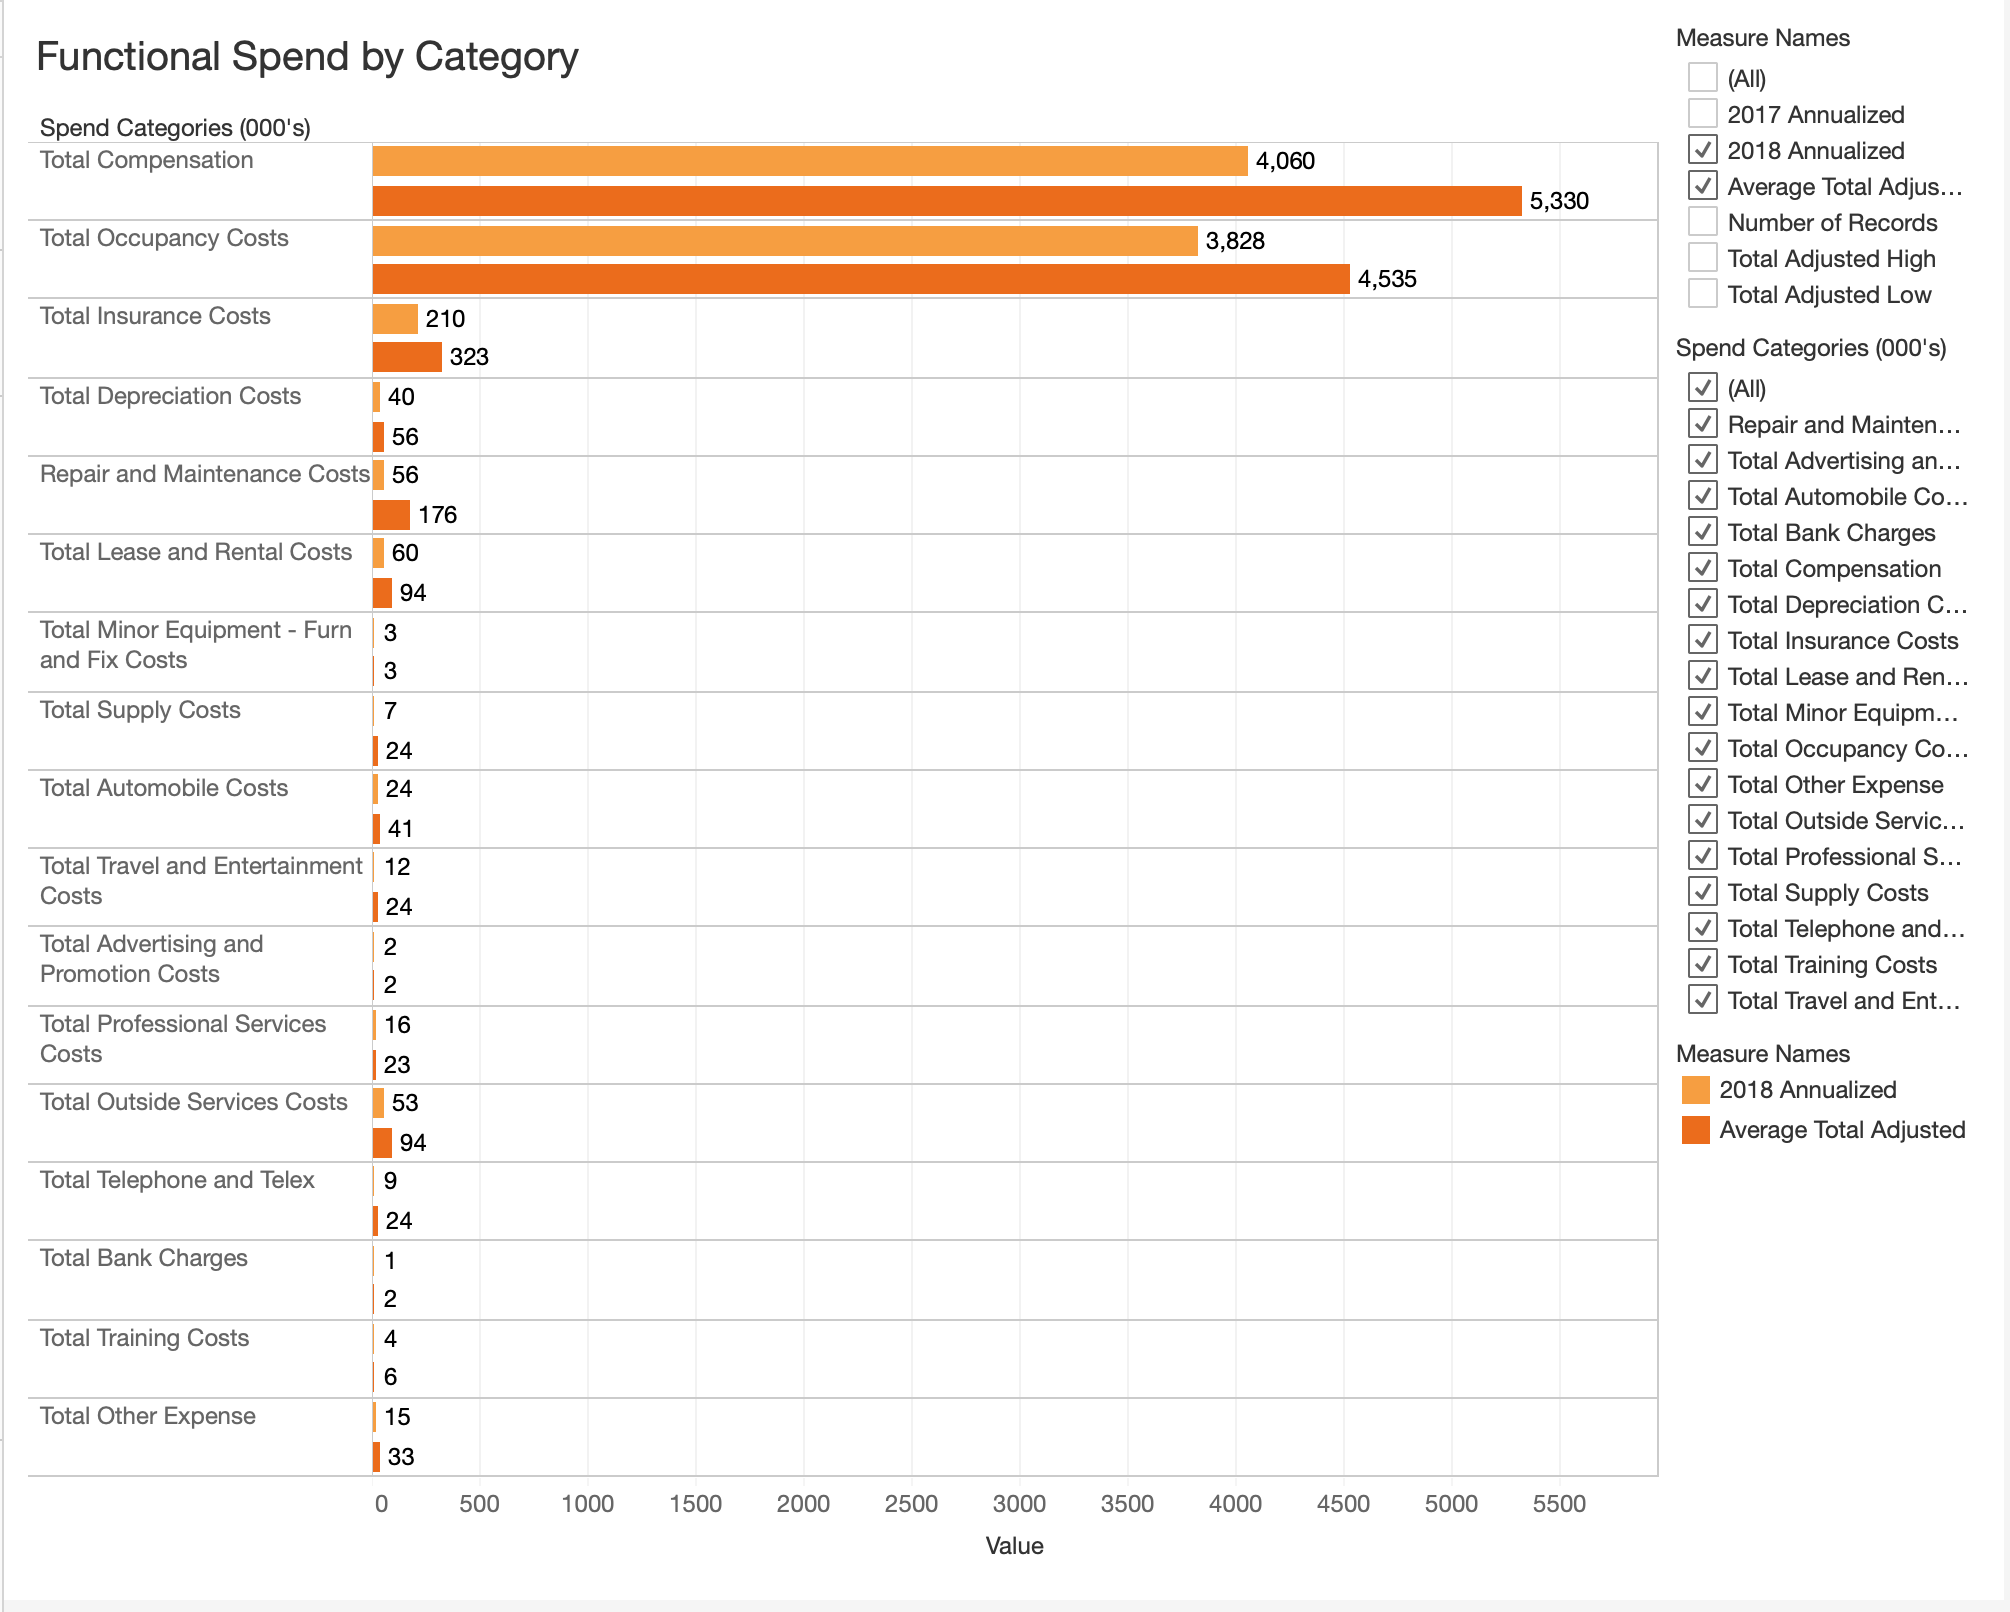
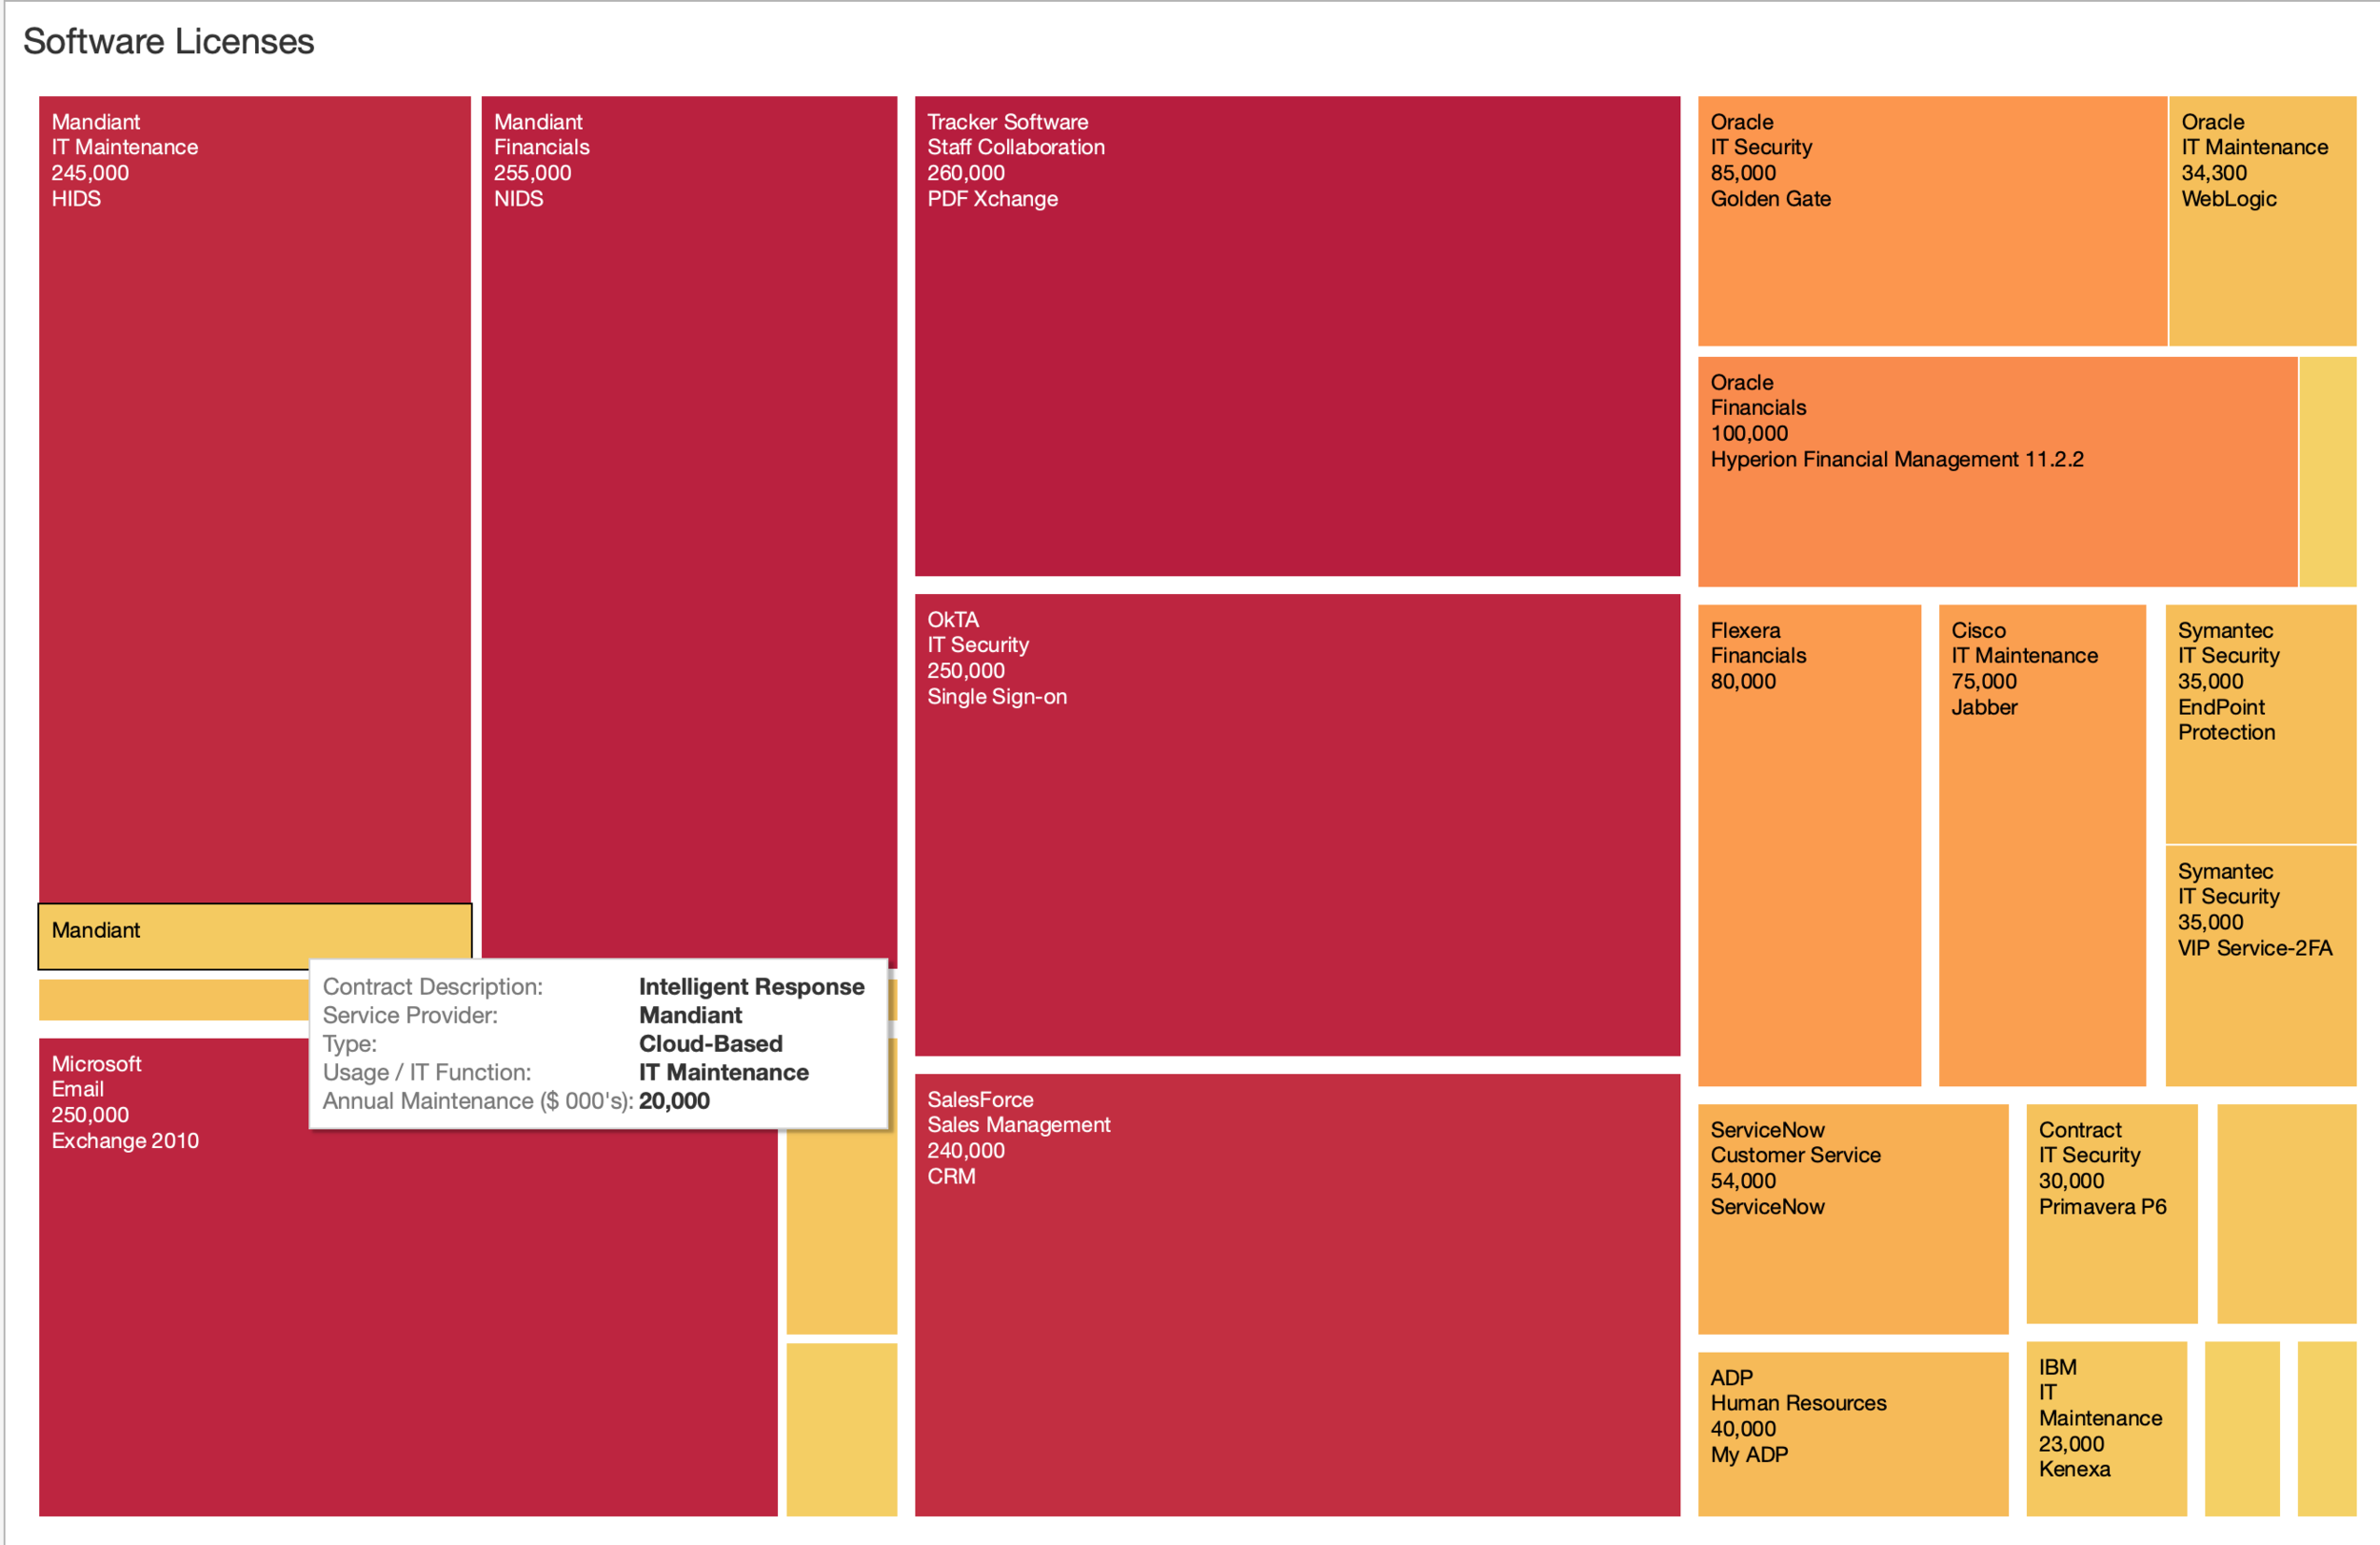
After that program, PwC requested our help to help them take initial steps towards an interim, automated system to visualize the data recorded on various companies. I created a series of dynamic dashboards using the software Tableau. PwC gave me example Excel files with dummy data, and I created a set of files and processes to collect the relevant data and create infographics to help deliver reports to stakeholders. This tool was to be used to start socializing the concept of the larger platform and create organizational change toward those efforts.